Periodic Properties of Elements (or Periodicity) - The electron configurations of the atoms present a periodic variation with increasing atomic number (or atomic weight). The elements in the periodic table display periodic variations of the physical and chemical behavior. The property trend of the elements is called Periodicity.
This module allows plotting of graph to illustrate element periodicity, a chart of elements vs their properties.
Plotting the Periodicity Chart is a two-step process. First add the data (elements and properties) into the periodicity data sheet on the Periodicity Sheet tab, then plot the chart by selecting the property on the Periodicity Chart tab.
To plot the relationship chart, build the data sheet first. This can be accomplished in two ways:
Drag-and-drop the selected elements from the Element Pad to the table column and selected properties from Property list.
Double-click the elements/properties to add the items into the periodicity spreadsheet.
1. Select the Periodicity Sheet tab from the Periodic Table module. If there is no pre-defined table, the Periodicity Wizard appears.
The upper left portion of the dialog is the Periodic Table, on its right, it is the element list box, where the selected elements enlist there. The lower left is the list of element properties available and the right is the property list box, where the selected properties enlist there.

2. To add elements to the data sheet, either double-click on the element in the Periodic Table or drag-n-drop the element from the Periodic Table to the list box. You can also add the entire group or row of elements all together by dragging the their Group/Row labels (e.g. 2A or 2) and dropping into the list box.
3. To add properties to the data sheet, select the property in the available list and click Add, the highlighted property will be added to the property list box on the right. The reverse can be done, to remove a selected item, select the item on the right and click Remove.
4. When the elements and properties desired have been added their list boxes, click OK to add them to the data sheet.
5. The Periodicity Sheet page appears. Notice the elements and properties selected are listed in the spreadsheet.
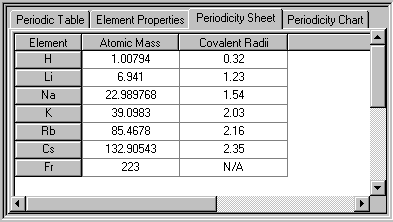
Note: A column can be sorted by double-clicking the column label. The small down-arrow symbol will be placed on the right of the label to indicate the sorted column.
On the Periodicity Sheet tab, the Periodicity Sheet menu appears as shown below.
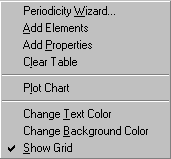
Periodicity Wizard - This is the wizard to add elements and properties into the data table as illustrated above.
Add Element - opens the Element Pad to add elements into the table.
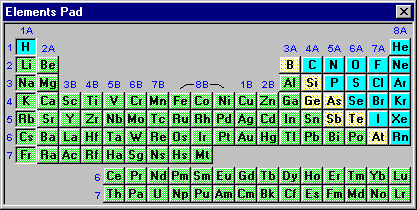
To add an element into the table, just double-click the element in the table and click x at the upper right corner to close the element pad.
Add Property - opens the Available Property list to add properties into the table.
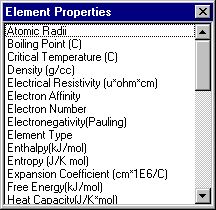
To add a property into the table, just double-click the property in the list and click x at the upper right corner to close the Element Properties list.
Clear Table - remove all data in the table.
Plot Chart - opens the Plot Wizard.
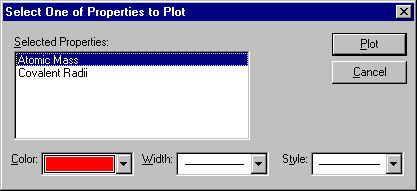
Select the property to be plotted against the elements selected in the table, click Plot. You can also select the color, width and style of the chart by selecting the settings from the drop-down lists.
Change Text Color - change the table label and data colors.
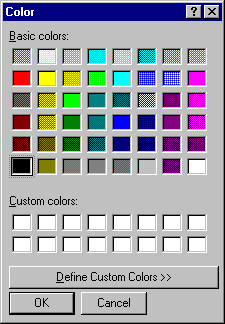
Select the desired color for the text and click OK to set it. You can also define more colors by clicking the Define Custom Colors button. The expanded color palette allows RGB colors to be selected.
Change Background Color - change the background color of the table.
The same color dialog appears and allows selection of background color.
Show Grid - display grid lines for the table.
Upon adding the data into the spreadsheet, the periodicity chart can be plotted using these data.
Before you can plot the chart, the data must be added into the table. You can plot only one property at a time.
1. Click on the Periodicity Chart tab or select Plot Chart from the Periodicity Sheet menu. The Select the Property dialog appears.

2. Select the property to be plotted against the elements selected in the table, click Plot. You can also select the color, width and style of the chart by selecting the settings from the drop-down lists. Click Plot to plot the chart of the selected property vs the elements in the table.
3. The line chart appears with the selected settings.

The x-axis (horizontal) is for the elements and the y-axis (vertical) is for the property selected.
On the Periodicity Chart tab, there is a list of menu commands available.
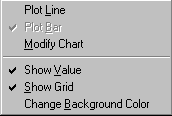
Plot Line - give a line plot of the chart.
Plot Bar - give a bar plot of the chart.
Modify Chart - Change the settings of the plot, such as new property, color, width and style.

Show Value - Turn on/off the property values on the plot.
Show Grid - Turn on/off the line grid of the chart.
Change Background Color - Change the color of the background by selecting a new color from the color chart.
Here is the same plot with different settings.
